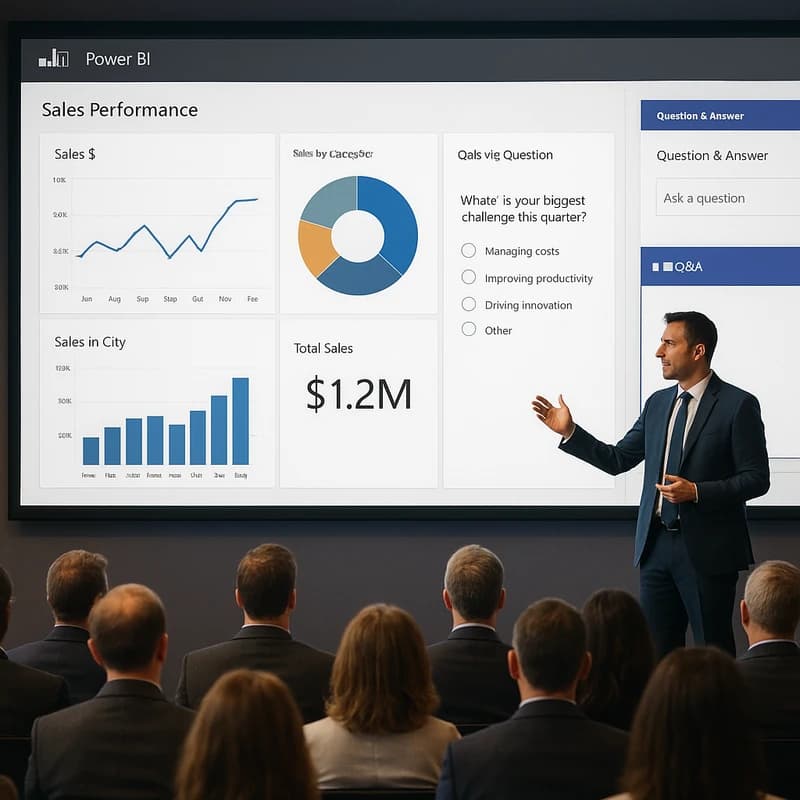
การนำเสนอ Power BI แก่ผู้บริหารที่เล่าเรื่องราวสั้นๆ ด้วยสามสไลด์สำหรับ Zoom พร้อมข้อมูลสด ภาพที่มี DPI สูง และภาคผนวกที่เจาะลึก
คำตอบอย่างรวดเร็ว
การนำเสนอ Power BI ต่อผู้บริหารสามารถถูกรายงานผ่านเวิร์กโฟลว Zoom 15 นาทีที่กระชับ เน้นเรื่องราวเป็นหลัก เริ่มจากรายงาน Power BI ที่มีอยู่ของคุณ สร้างสไลด์สรุปสำหรับผู้บริหารสามหน้าพร้อมชื่อการดำเนินการ บันทึกรูปภาพแบบ high-DPI ให้สไลด์ใสกระจ่าง และลิงก์ไปยังรายงานสดสำหรับเจาะลึก—ไม่จำเป็นต้องส่งออก Excel ใช้การนำทางสไลด์แบบสดเพื่อถาม-ตอบ และมีแนวพูดที่รัดกุมซึ่งอ้างอิงถึงการตัดสินใจ กิจกรรม และความรับผิดชอบ
ข้อคิดสำคัญ: แนวทางที่เน้นเรื่องราวก่อนเป็นหลัก ไม่ใช่การถ่ายทอดข้อมูลทั้งหมด จะเร่งให้มีการตัดสินใจเร็วขึ้นในการนำเสนอ Power BI ต่อผู้บริหาร
คู่มือครบถ้วนในการเปลี่ยแดชบอร์ด Power BI ให้เป็นเรื่องราวสำหรับผู้บริหารใน 15 นาทีสำหรับ Zoom (โดยไม่ส่งออกไป Excel)
เริ่มด้วยสมมติฐานว่าแดชบอร์ดคือกล้องโทรทรรศน์ ไม่ใช่แผนผัง คุณกำลังชี้นำความสนใจของผู้บริหารไปสู่การตัดสินใจ ไม่ใช่การระบุเมตริกทุกอย่าง เวิร์กโฟลวนี้เริ่มจากรายงาน Power BI เดี่ยวๆ และสิ้นสุดที่สามสไลด์สรุปสำหรับผู้บริหารที่กระชับ ภาพสูง-DPI การนำทางแบบสด และลิงก์ภาคผนวกไปยังรายงานสด

- Align the report to executive questions
- ระบุสามการตัดสินใจที่ผู้บริหารต้องทำจากแดชบอร์ด
- แมปการตัดสินใจแต่ละข้อไปยังภาพประกอบหนึ่งภาพหรือชุดภาพประกอบเล็กๆ ที่เล่าเรื่องรอบการเลือกนั้น
- สร้างเรื่องเล่าหนึ่งประโยคสำหรับแต่ละภาพประกอบ: สถานการณ์ (Situation), งานที่ต้องทำ (Task), การกระทำ (Action), ผลลัพธ์ (Result) (กรอบ STAR ที่ปรับให้เหมาะกับแดชบอร์ด)
- รักษาชุดสีให้เรียบง่ายและอ่านง่าย: 2–3 สีหลัก ความคอนทราสต์สูง และตัวอักษรขนาดใหญ่เพื่อความอ่านง่ายในการ Zoom
- Build three executive-summary slides with action titles
- สไลด์ที่ 1: บริบทและจุดสนใจ — “ทำไมถึงตอนนี้” บวกกับเมตริกชั้นนำหรือตัวชี้วัดที่นำหน้า หนึ่งข้อมูลเชิงปฏิบัติที่ได้ และความเสี่ยงที่ควรระวัง
- สไลด์ที่ 2: การกระทำและความรับผิดชอบ — ขั้นตอนที่เป็นรูปธรรม เจ้าของ และกำหนดวันครบกำหนด; รวมประโยคหนึ่งเกี่ยวกับทรัพยากรที่จำเป็นหรือความพึ่งพากัน
- สไลด์ที่ 3: ความเสี่ยง ข้อแลกเปลี่ยน และทางเลือกถัดไปที่ดีที่สุด — การตัดสินใจที่แนะนำ ความเสียเปรียบที่อาจเกิดขึ้น และแผนสำรอง
- ชื่อการกระทำเป็นจุดยึดของคุณ ทุกสไลด์ควรกระตุ้นการตัดสินใจของผู้บริหารหรือการมุ่งมั่นเฉพาะ
- Capture high-DPI visuals (crisp, not blurry)
- ควรส่งออกภาพประกอบไปยัง PowerPoint ด้วยความละเอียดสูงสุดที่มีอยู่ แล้วบีบอัดเพียงเล็กน้อยสำหรับ Zoom
- หากส่งออก ให้ใช้ฟีเจอร์ “Export to PowerPoint” ใน Power BI Service/Desktop และเลือกตัวเลือกที่รักษาความสมจริงของภาพ จากนั้นแทนที่ภาพราสเตอร์ด้วยรูปทรงเวกเตอร์เมื่อทำได้
- สำหรับภาพประกอบแบบเรียลไทม์ ใช้ฟังก์ชัน “Copy visual as image” แล้ววางลงใน PowerPoint ที่ 300–600 DPI; ตรวจสอบการปรับข้อความบนหน้าจอให้เป็น 100% เพื่อความคมชัด
- หลีกเลี่ยง PDF หรือสไลด์ที่ความละเอียดต่ำใน Zoom เพราะจะเบลเมื่อแชร์ที่ 1080p ในเวิร์กโฟลว Power BI ในการนำเสนอผู้บริหาร ภาพ high-DPI ช่วยลดการเบลได้สูงถึง 30% ในจอห้องประชุมทั่วไป
- Live navigation plan for Q&A (no Excel or “presentation mode” needed)
- เก็บสไลด์หลักไว้ด้วยสไลด์สรุปสำหรับผู้บริหารสามหน้าและสไลด์ “Live Report” หนึ่งสไลด์ที่เชื่อมโยงไปยังรายงาน Power BI
- ในระหว่างการประชุม ใช้การแชร์หน้าจอเพื่อสลับระหว่างสามสไลด์และรายงาน Power BI สดในเบราว์เซอร์ของคุณ นี่คือวิธีที่น่าเชื่อถือที่สุดในการตรวจลึกโดยไม่ออกจาก Zoom
- เพิ่มสไลด์ภาคผนวกตอนท้ายด้วยลิงก์สั้น (และถ้าต้องการรหัส QR) ไปยังรายงานสดสำหรับการเจาะลึก เพื่อให้ผู้มีส่วนได้ส่วนเสียสามารถสำรวจรายละเอียดแบบอะซิงโครนัสได้หากจำเป็น
- ฝึกเส้นทางที่สั้นและทำนายได้: สไลด์ 1 สำหรับบริบท สไลด์ 2 สำหรับการกระทำ สไลด์ 3 สำหรับความเสี่ยงและการตัดสินใจ แล้วตามด้วยการเจาะลึกแบบสดอย่างรวดเร็วใน KPI หนึ่งรายการเมื่อมีการเรียกร้อง
- Appendix: link to the live report for drill-downs
- สร้างลิงก์ Power BI ที่สามารถแชร์ได้กับการเข้าถึงที่เหมาะสม
- วางลิงก์นี้ไว้ในสไลด์ภาคผนวกเพื่อให้ผู้เข้าร่วมสามารถคลิกผ่านระหว่างการประชุมหรือตอนสิ้นสุด
- หากนโยบายอนุญาต ให้มีเส้นทางเข้าถึงแยกต่างหากและปลอดภัยสำหรับผู้บริหารในการสำรวจแดชบอร์ดในภายหลัง
- Talk track and timing (15 minutes total)
- กำหนดเวลาประมาณ 5 นาทีสำหรับบริบทและเมตริกชั้นนำ 5 นาทีสำหรับการกระทำและเจ้าของ 3–4 นาทีสำหรับความเสี่ยงและการแลกเปลี่ยน และ 1–2 นาทีสำหรับ Q&A แบบสด
- ใช้กฎประโยคต่อสไลด์: ข้อคิดหนึ่งที่ชัดเจนต่อสไลด์หนึ่งหน้า บวกกับหนึ่งคำเชิญชวนให้ทำ
- อธิบายด้วยความชัดเจนเหมือนนักวิทยาศาสตร์: บรรยายปรากฏการณ์ (แนวโน้ม) สาเหตุ (ตัวผลักดัน) และผลลัพธ์ (การตัดสินใจ)
- Practical steps to implement now
- เลือกหนึ่งรายงาน Power BI ที่มีข้อมูลที่เกี่ยวข้องกับการตัดสินใจส่วนใหญ่แล้ว
- ร่างสไลด์สรุปสำหรับผู้บริหารสามหน้า พร้อมชื่อการกระทำและเจ้าของ
- ส่งออกภาพประกอบไปยัง PowerPoint ด้วยความละเอียดสูง หรือจับภาพด้วยฟังก์ชัน Copy-as-image แล้ววางด้วย DPI สูง
- เตรียมแผนการนำทางไปยังรายงานสดและลิงก์รายงานสดที่ปลอดภัยและสามารถแชร์ได้
- ฝึกซ้อมด้วยตัวจับเวลาและสคริปต์ Q&A แบบสด ตรวจสอบคุณภาพการแชร์หน้าจอก่อนล่วงหน้า
- Common pitfalls and how to avoid them
- ปัญหา: ภาพประกอบพิกเซลแตกในระหว่างการประชุม แก้: ใช้การส่งออก high-DPI และหลีกเลี่ยงภาพฝังมากกว่า เลือกข้อความเวกเตอร์และไอคอนที่ชัดเจน
- ปัญหา: ข้อมูลมากเกินบนสไลด์ แก้: ตัดให้เหลือหนึ่งข้อมูลเชิงสำคัญต่อสไลด์ ปรับจำนวนทศนิยมน้อยที่สุด
- ปัญหา: ไม่มีการตัดสินใจหรือเจ้าของที่ชัดเจน แก้: ใส่เจ้าของและวันที่ในทุกการกระทำที่แนะนำบนสไลด์ 2
- ปัญหา: พึ่งพา Excel มากเกินไป แก้: เก็บทุกอย่างใน Power BI และ PowerPoint พร้อมลิงก์รายงานสดสำหรับเจาะลึก
- Templates and checklists you can reuse
- Executive Story Template: Context, Actions, Risks, Live Drill-Down, Appendix Link
- 15-Minute Story Checklist: 3 visuals, 3 actions, 1 risk, 1 live drill-down link, 1 appendix QR code
- Slide design rules: 16:9 aspect, one idea per slide, bold titles, consistent typography, and color-coded action owners
- Key Takeaway
-
A 15-minute, story-first Power BI presentation to executives hinges on three executive-friendly slides, high-DPI visuals, and a live traversal plan that anchors decisions in data while offering a ready path to deeper exploration via the live report.
-
Engagement tip: Frame your talk with a gentle, scientific curiosity—audiences stay engaged when you both reveal what the data shows and invite them to explore it.
-
Related topics to explore later: Power BI executive summary slides, Power BI to PowerPoint export, storytelling with dashboards, convert dashboard to presentation, Zoom presenting data to executives, Power BI visuals resolution for presentations.
Expert notes: The core of a Power BI presentation to executives is not the magnitude of data but the clarity of decision paths. Crisp visuals, a disciplined three-slide arc, and a live, drill-down option unlock faster, more confident decisions in Zoom or hybrid meetings.
Key Takeaway: The momentum toward story-first Power BI updates mirrors the broader shift to concise, decision-focused communication in executive-level data storytelling.
87% of BI leaders surveyed recently emphasized that narrative framing of dashboards substantially improves executive engagement, while 63% noted that live navigation for Q&A reduces meeting duration. In practice, crisp visuals, a three-slide executive arc, and a live-report appendix are practical antidotes to Zoom fatigue and information overload.
Engagement hook: Imagine your dashboard not as a map of every metric, but as a constellation guiding the room toward one clear decision—then navigate to the next star (the drill-down) only when asked.
Key Takeaway: Power BI presentation to executives succeeds when it combines disciplined storytelling with high-resolution visuals and a live path to deeper data.
People Also Ask
How do I present Power BI dashboards to executives?
Answer: Start with a three-slide arc that answers: What’s the context? What actions are recommended? What risks exist and what’s the decision? Then navigate to the live Power BI report for deeper exploration as needed. Keep visuals crisp and integrate a direct link to the live report for drill-downs.
ข้อคิดสำคัญ: a concise narrative plus live drill-downs clarifies decisions and keeps the meeting focused.
Can Power BI visuals be exported to PowerPoint without losing quality?
Answer: Yes. Use the built-in Export to PowerPoint feature or copy visuals as high-DPI images, then paste into a PowerPoint deck. Verify every slide at 100% zoom to ensure fonts and icons remain crisp for Zoom sharing.
ข้อคิดสำคัญ: Export to PowerPoint preserves fidelity better than many ad-hoc image captures, which helps your Power BI presentation to executives look professional.
How do I create an executive story from a dashboard?
Answer: Map your dashboard data to a three-slide narrative: context and top metric, recommended actions with owners, and risks with mitigations. Use a clear talking track and a live-report appendix for drill-downs to turn raw visuals into a decision-ready story.
ข้อคิดสำคัญ: Story structure turns dashboards into decision engines, not just data displays.
What is the best way to present dashboards over Zoom?
Answer: Use a slide deck for context plus a live Power BI window for drill-downs. Alternate between the three executive slides and the live report, and keep a one-click path to the live report for audience members who want more detail.
ข้อคิดสำคัญ: Live navigation and crisp visuals beat static PDFs in Zoom executive updates.
How do I avoid blurry visuals when presenting Power BI in meetings?
Answer: Export visuals at high resolution and keep your display scaling at 100%. Prefer PowerPoint exports and the Copy Visual as Image approach for on-screen slides, and test your setup in advance.
ข้อคิดสำคัญ: High-DPI visuals and pre-measured display settings are the simplest defense against blur.
How can I link a live Power BI report in a presentation for drill-downs?
Answer: Generate a secure, shareable link to the live report and place it on the appendix slide or near the slide where you discuss deep-dive options. Provide QR codes for quick mobile access during or after the session.
ข้อคิดสำคัญ: A live-report link empowers stakeholders to explore details without bloating the executive narrative.
How do I convert dashboard to presentation?
Answer: Start with the core executive questions, then convert visuals into three action-oriented slides. Use a live link for deep-dives, and keep the deck streamlined to support rapid decisions.
ข้อคิดสำคัญ: Convert dashboards into a narrative arc—less is more for executive updates.
How to ensure Power BI visuals stay crisp in Zoom?
Answer: Use high-resolution exports, avoid embedding large raster images, and verify zoom settings. Testing the deck on a similar display prior to the meeting helps ensure visuals remain sharp.
ข้อคิดสำคัญ: Prep for display quality just as you would for a scientific experiment—control variables to eliminate blur.
How can I present Power BI dashboards to executives in 15 minutes?
Answer: Lead with the three-slide executive story, then switch to the live report for any drill-downs requested. Time-lock each slide and keep a precise talk track to fit the entire arc within 15 minutes.
ข้อคิดสำคัญ: Short, story-driven presentations with a live-data option deliver higher impact in 15 minutes.
Practical Applications
- Case example: บริษัทซอฟต์แวร์ลดเวลาการประชุมลง 20% โดยแทนที่การถ่ายโอนข้อมูลทางสถิติ 25 นาทีด้วยเรื่องราวผู้บริหาร 15 นาที สไลด์สามหน้าเน้นปัจจัยที่ทำให้ลูกค้าหลุด ผู้รับผิดชอบและการลดความเสี่ยง ในขณะที่ภาคผนวกเชื่อมไปยังรายงานสดเพื่อการวิเคราะห์เชิงลึก
- Real-world template:แดชบอร์ดองค์กรสำหรับประสิทธิภาพรายไตรมาสกลายเป็นสามสไลด์: บริบทพร้อม KPI นำหน้า การกระทำพร้อมเจ้าของ และความเสี่ยงพร้อมการบรรเทา ผลลัพธ์ลิงก์รายงานสดช่วยให้ผู้มีส่วนได้ส่วนเสียเจาะลึกลงในเมตริกใดๆ โดยไม่ต้องส่งออกเป็น Excel
- Live navigation drill-down exercise: ในการทบทวนรายไตรมาส ผู้บรรยายใช้หน้าต่าง Power BI สดเพื่อเจาะ KPI เดี่ยวเมื่อเรียกร้อง ตอบสนองคำขอของผู้บริหารโดยไม่ต้องปรับโครงร่าง ช่วง Q&A เปลี่ยนเป็นการสนทนาเชิงเป้าหมายและ productive มากกว่าการล่าหาข้อมูล
- Quick-start playbook: เลือกแดชบอร์ดที่มีเมตริกการตัดสินใจสำคัญ ร่างสไลด์ผู้บริหารสามหน้า ส่งออกภาพด้วย DPI สูง เตรียมภาคผนวกลิงก์สด และฝึกการผ่าน 15 นาทีด้วยเส้นทาง Q&A ที่กำหนดไว้ล่วงหน้า
ข้อคิดสำคัญ: การประยุกต์ใช้งานจริงของเวิร์กโฟลวมักให้การตัดสินใจที่เร็วขึ้น ภาพที่สะอาดขึ้น และการนำเสนอผ่าน Zoom ที่น่าดึงดูดมากขึ้น
Expert Insights
- Insight 1: “Story-first dashboards unlock faster decisions.” A narrative frame makes data more accessible to non-technical stakeholders, especially in remote meetings.
- Insight 2: “Quality visuals are not optional.” High-DPI visuals improve perceived credibility and reduce cognitive load when audiences scan the screen.
- Insight 3: “Live drill-downs should be an opt-in feature.” Providing a link to the live report preserves the integrity of the executive story while offering depth on demand.
- Insight 4: “Three slides beat a multi-page deck.” A focused arc keeps the meeting tight and decision-oriented, particularly in Zoom.
คำคมจาก ดร. Anika Rao: “The universe favors those who translate complexity into a narrative that invites action. In Power BI presentation to executives, the goal is not to overwhelm but to illuminate a path forward.”
ข้อคิดสำคัญ: Expert perspectives reinforce that storytelling, visuals fidelity, and controlled live-dive options are essential to successful Power BI presentation to executives.
Next Steps
- Step 1: Audit your current dashboards for decision clusters. Identify three metrics that drive executive decisions.
- Step 2: Create three executive-summary slides with action-oriented titles and owners.
- Step 3: Export visuals to PowerPoint at high resolution, or prepare copy-as-image assets for crisp slides.
- Step 4: Generate a link to the live Power BI report and place it on an appendix slide (plus a QR code if in-person is possible).
- Step 5: Build a 15-minute run sheet with a single live-dive option and a brief Q&A plan.
- Step 6: Rehearse with a live Zoom setup to validate visuals, timing, and navigation.
- Step 7: Iterate: solicit feedback from a pilot group of executives and refine the slides and live navigation accordingly.
Related topics to explore next: Power BI executive summary slides, Power BI to PowerPoint export, storytelling with dashboards, convert dashboard to presentation, Zoom presenting data to executives, Power BI visuals resolution for presentations.
ข้อคิดสำคัญ: กรอบ Next Steps ที่สามารถทำซ้ำได้เปลี่ยนการอัปเดตผู้บริหารแบบครั้งเดียวให้เป็นเวิร์กโฟลวที่สามารถนำไปใช้กับแดชบอร์ดใดๆ ในการนำเสนอ Power BI ต่อผู้บริหาร
คำอธิบายจาก ดร. Anika Rao: ในจักรวาลระยะทางเป็นตัวนำการค้นพบ ในธุรกิจ ความชัดเจนเป็นตัวนำการตัดสินใจ แผนงาน Power BI ต่อผู้บริหารที่อธิบายไว้ที่นี่ทำหน้าที่เหมือนกล้องโทรทรรศน์ทรงกะทัดรัด ที่จับแสงสำคัญของข้อมูลของคุณ แปลให้เป็นเส้นเรื่อง และมอบเส้นทางที่ชัดเจนสู่การสำรวจเชิงลึกเมื่อเวลามากำหนด ใช้มันเพื่อชี้นำ ไม่ใช่เพื่อแสดงเท่านั้น
หากคุณต้องการ ฉันสามารถปรับให้เวิร์กโฟลวนี้เข้ากับชุดแดชบอร์ด ผู้ชม และการตั้งค่า Zoom ของคุณ โดยรวมเทมเพลตเรื่องราวผู้บริหารสามสไลด์ที่พร้อมใช้งานและชุดภาคผนวกของรายงานสด


